Viewing Events
There are two ways to view the events your application records: the Everscribe dashboard built for you and your team, and the embeddable components you can drop into your own product for your end-customers.
Most of this page covers the dashboard — search, filter, inspect, export. The final Embedding section covers the alternative.
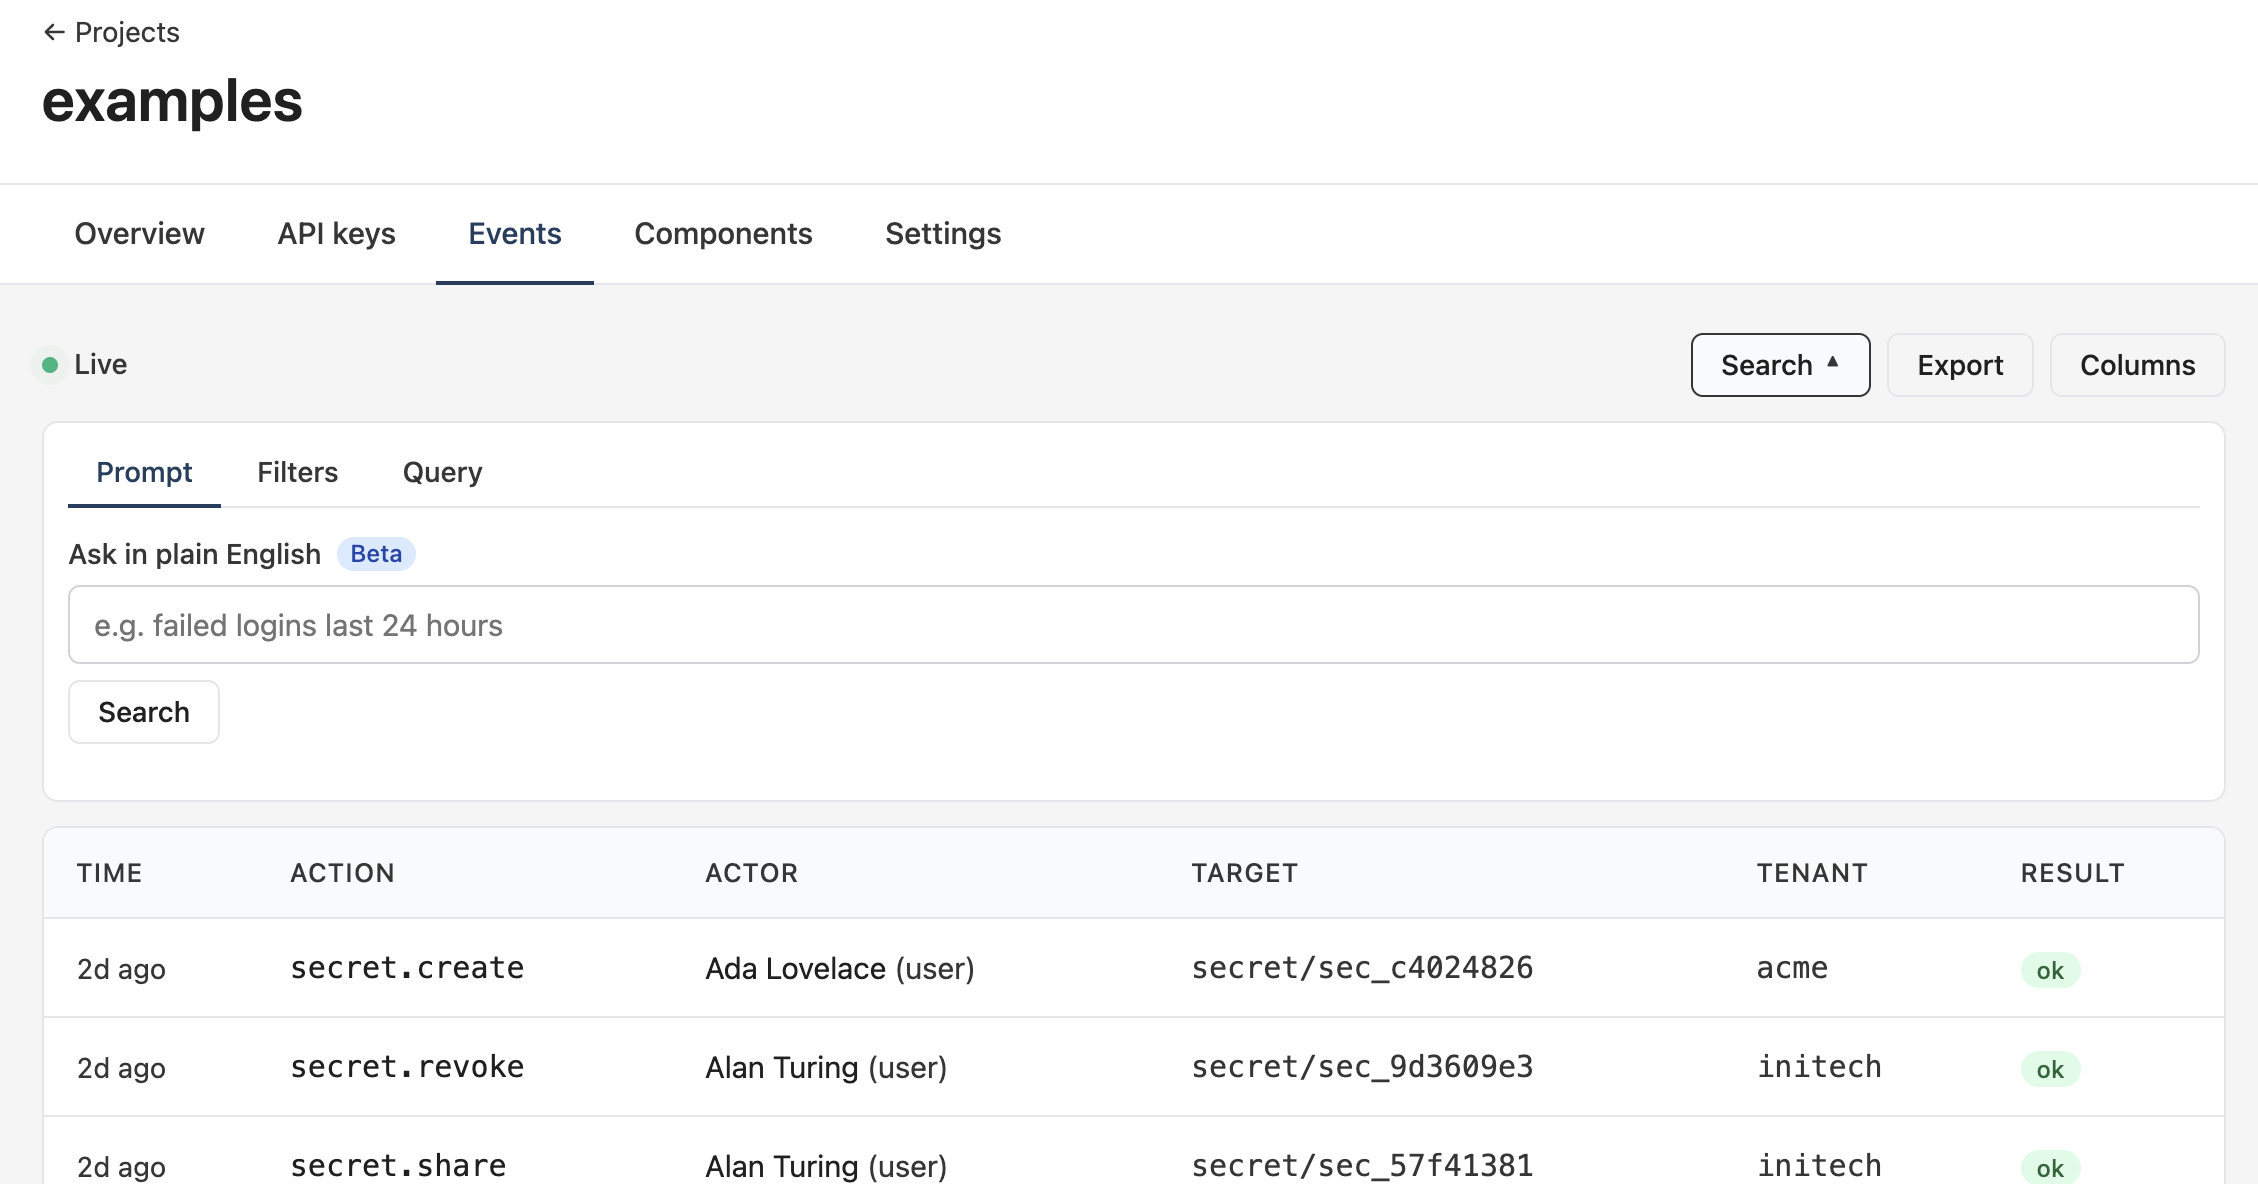
Open your project's Events tab to land on the dashboard. The event you just recorded shows up within a second or two. The list polls live — new events stream in at the top while you're looking at it.
Searching
The Search dropdown opens a three-tab panel for filtering: Prompt, Filters, and Query. Pick whichever matches how you want to think about the data.
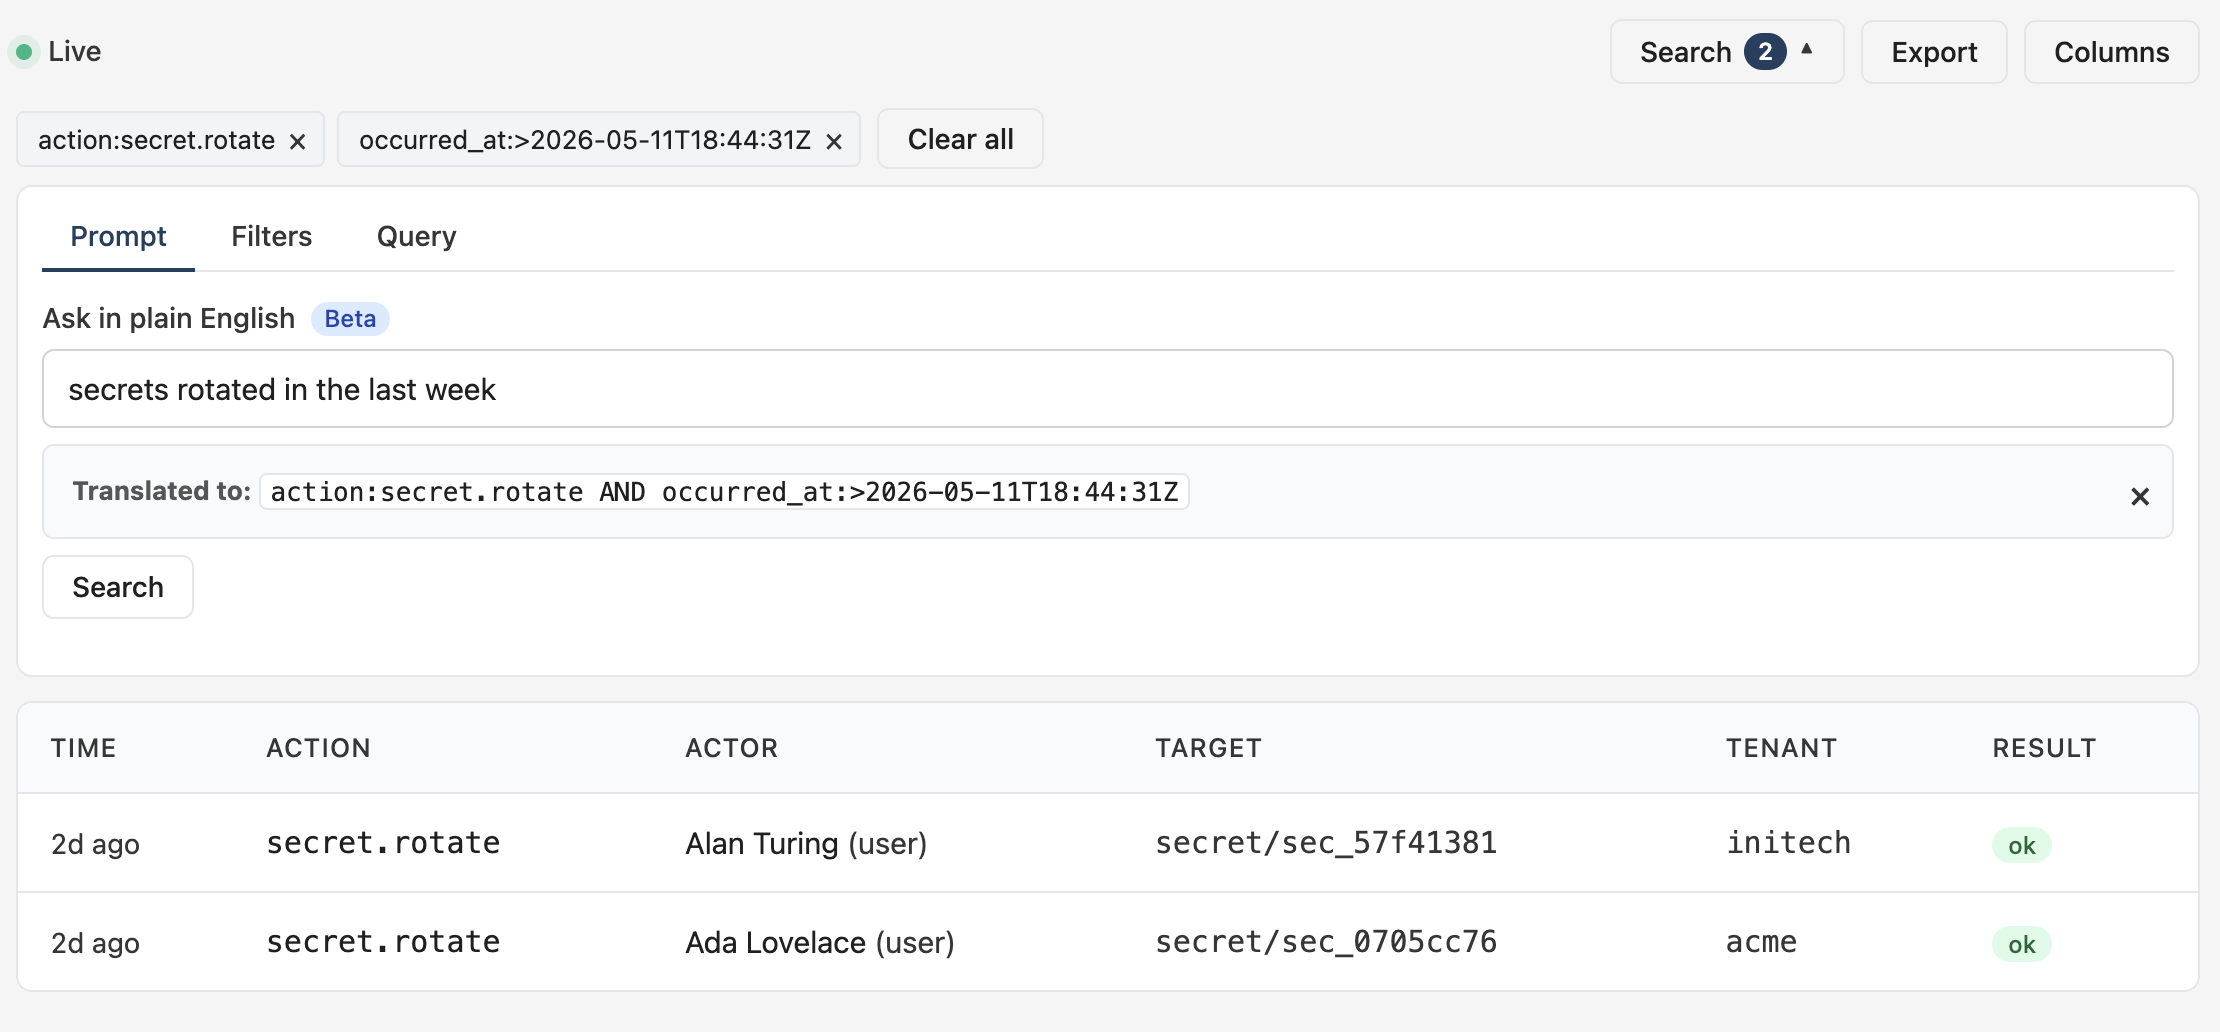
Prompt
The Prompt tab takes plain English. Type what you want — "failed logins last 24 hours", "secret rotations by Alan in the last week" — and the dashboard translates it into the filter DSL, runs the query, and echoes the translated DSL above the results so you can see what the model produced.
After submission, the translated DSL is shown verbatim. Each clause becomes a chip in the toolbar — click the × on any chip to drop that condition, or Clear all to start over. You can also copy the translated DSL into the Query tab and refine it by hand.
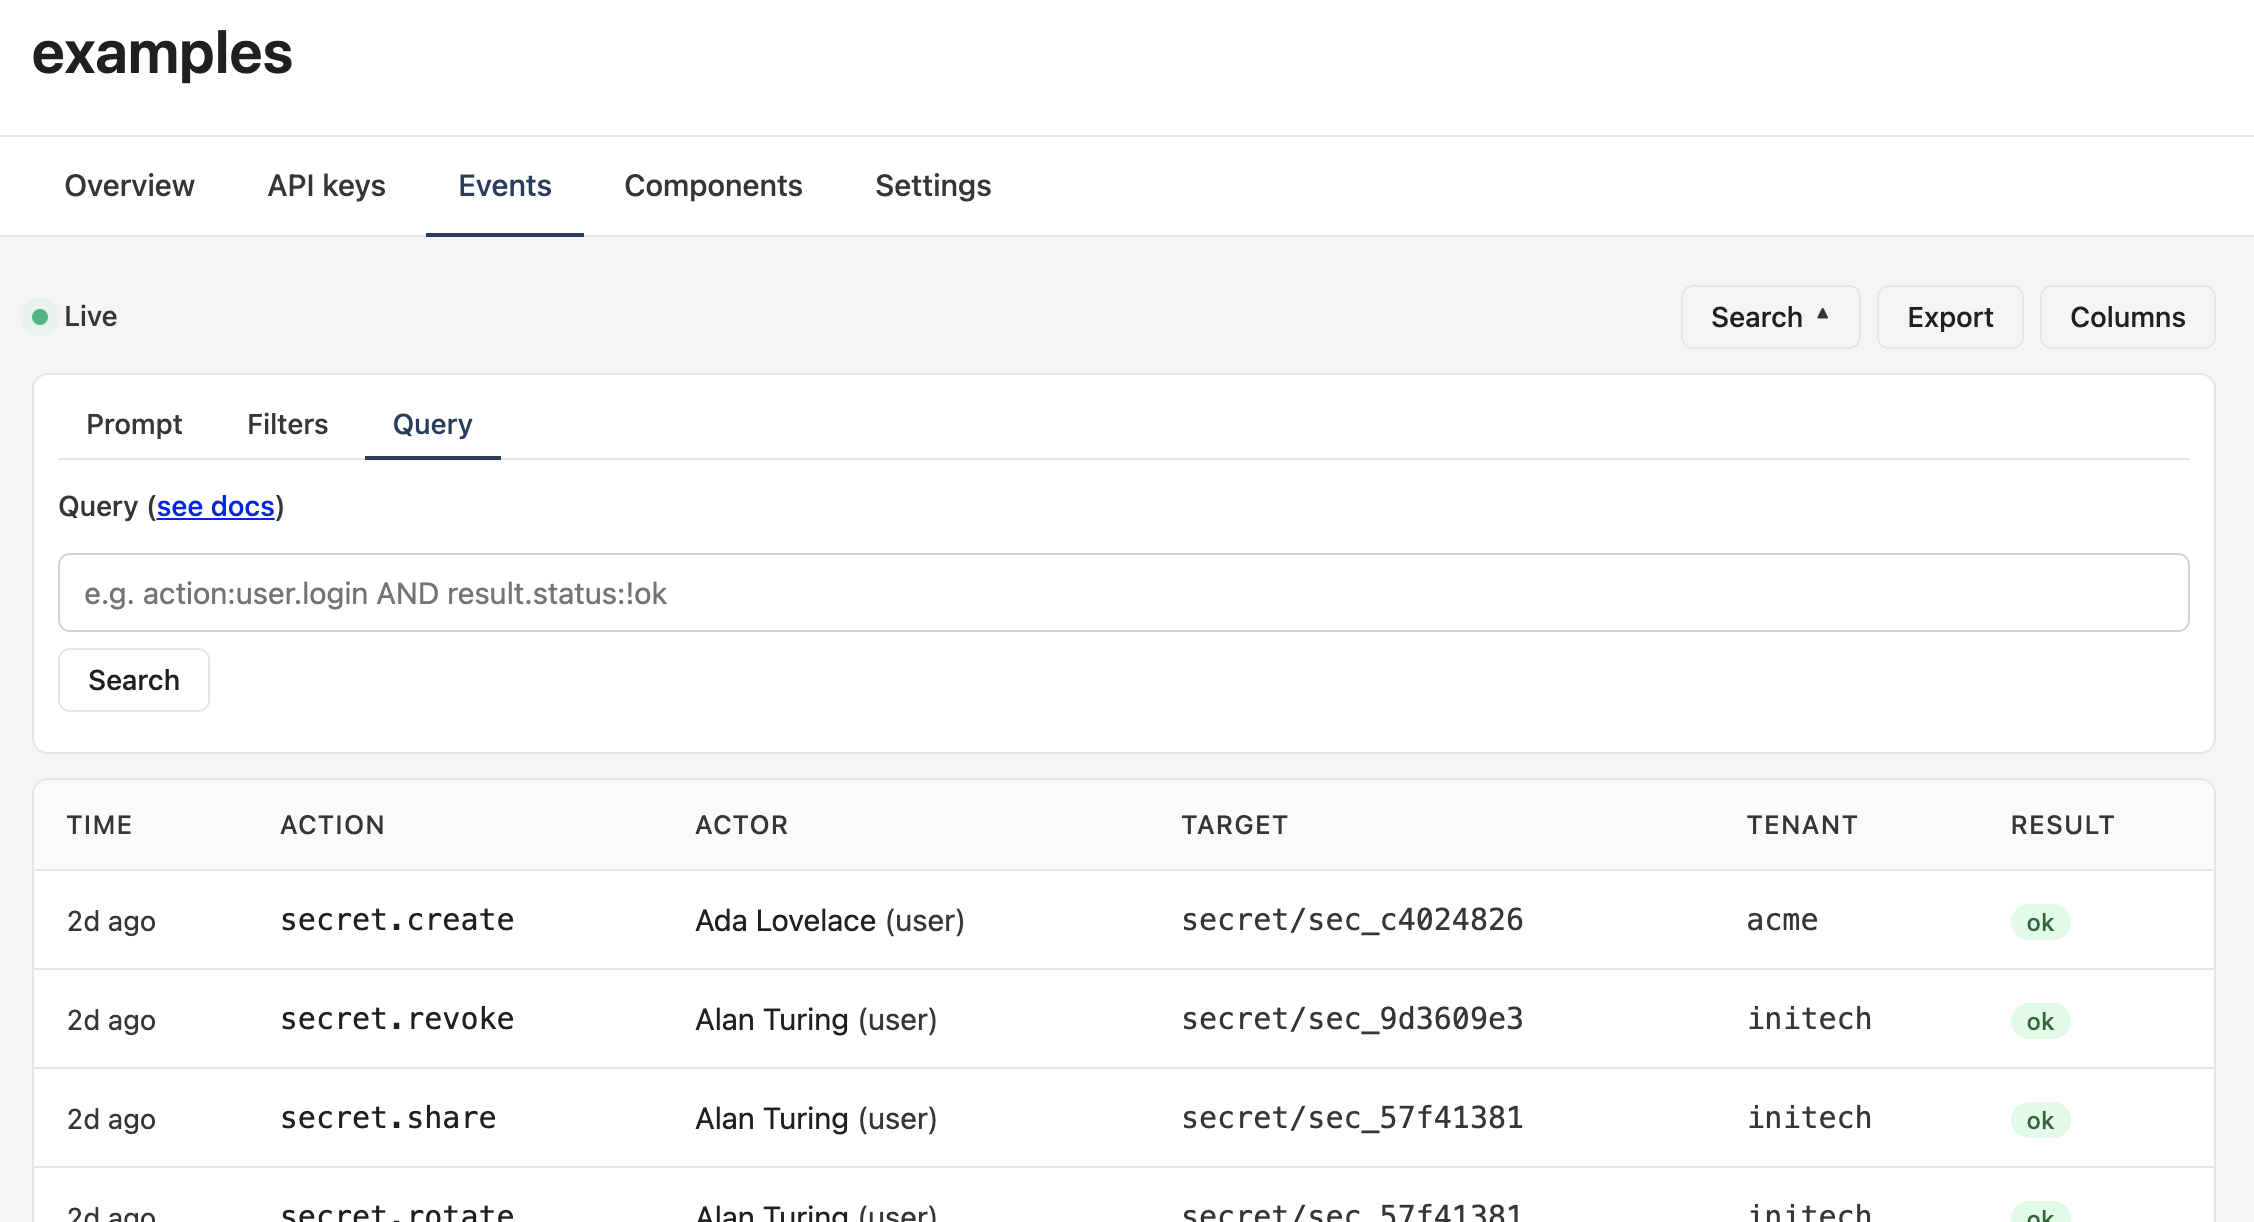
Query
The Query tab is a free-text input that accepts the filter DSL directly — for power users and anyone who's been around long enough to know the syntax. Submission replaces any active column filters.
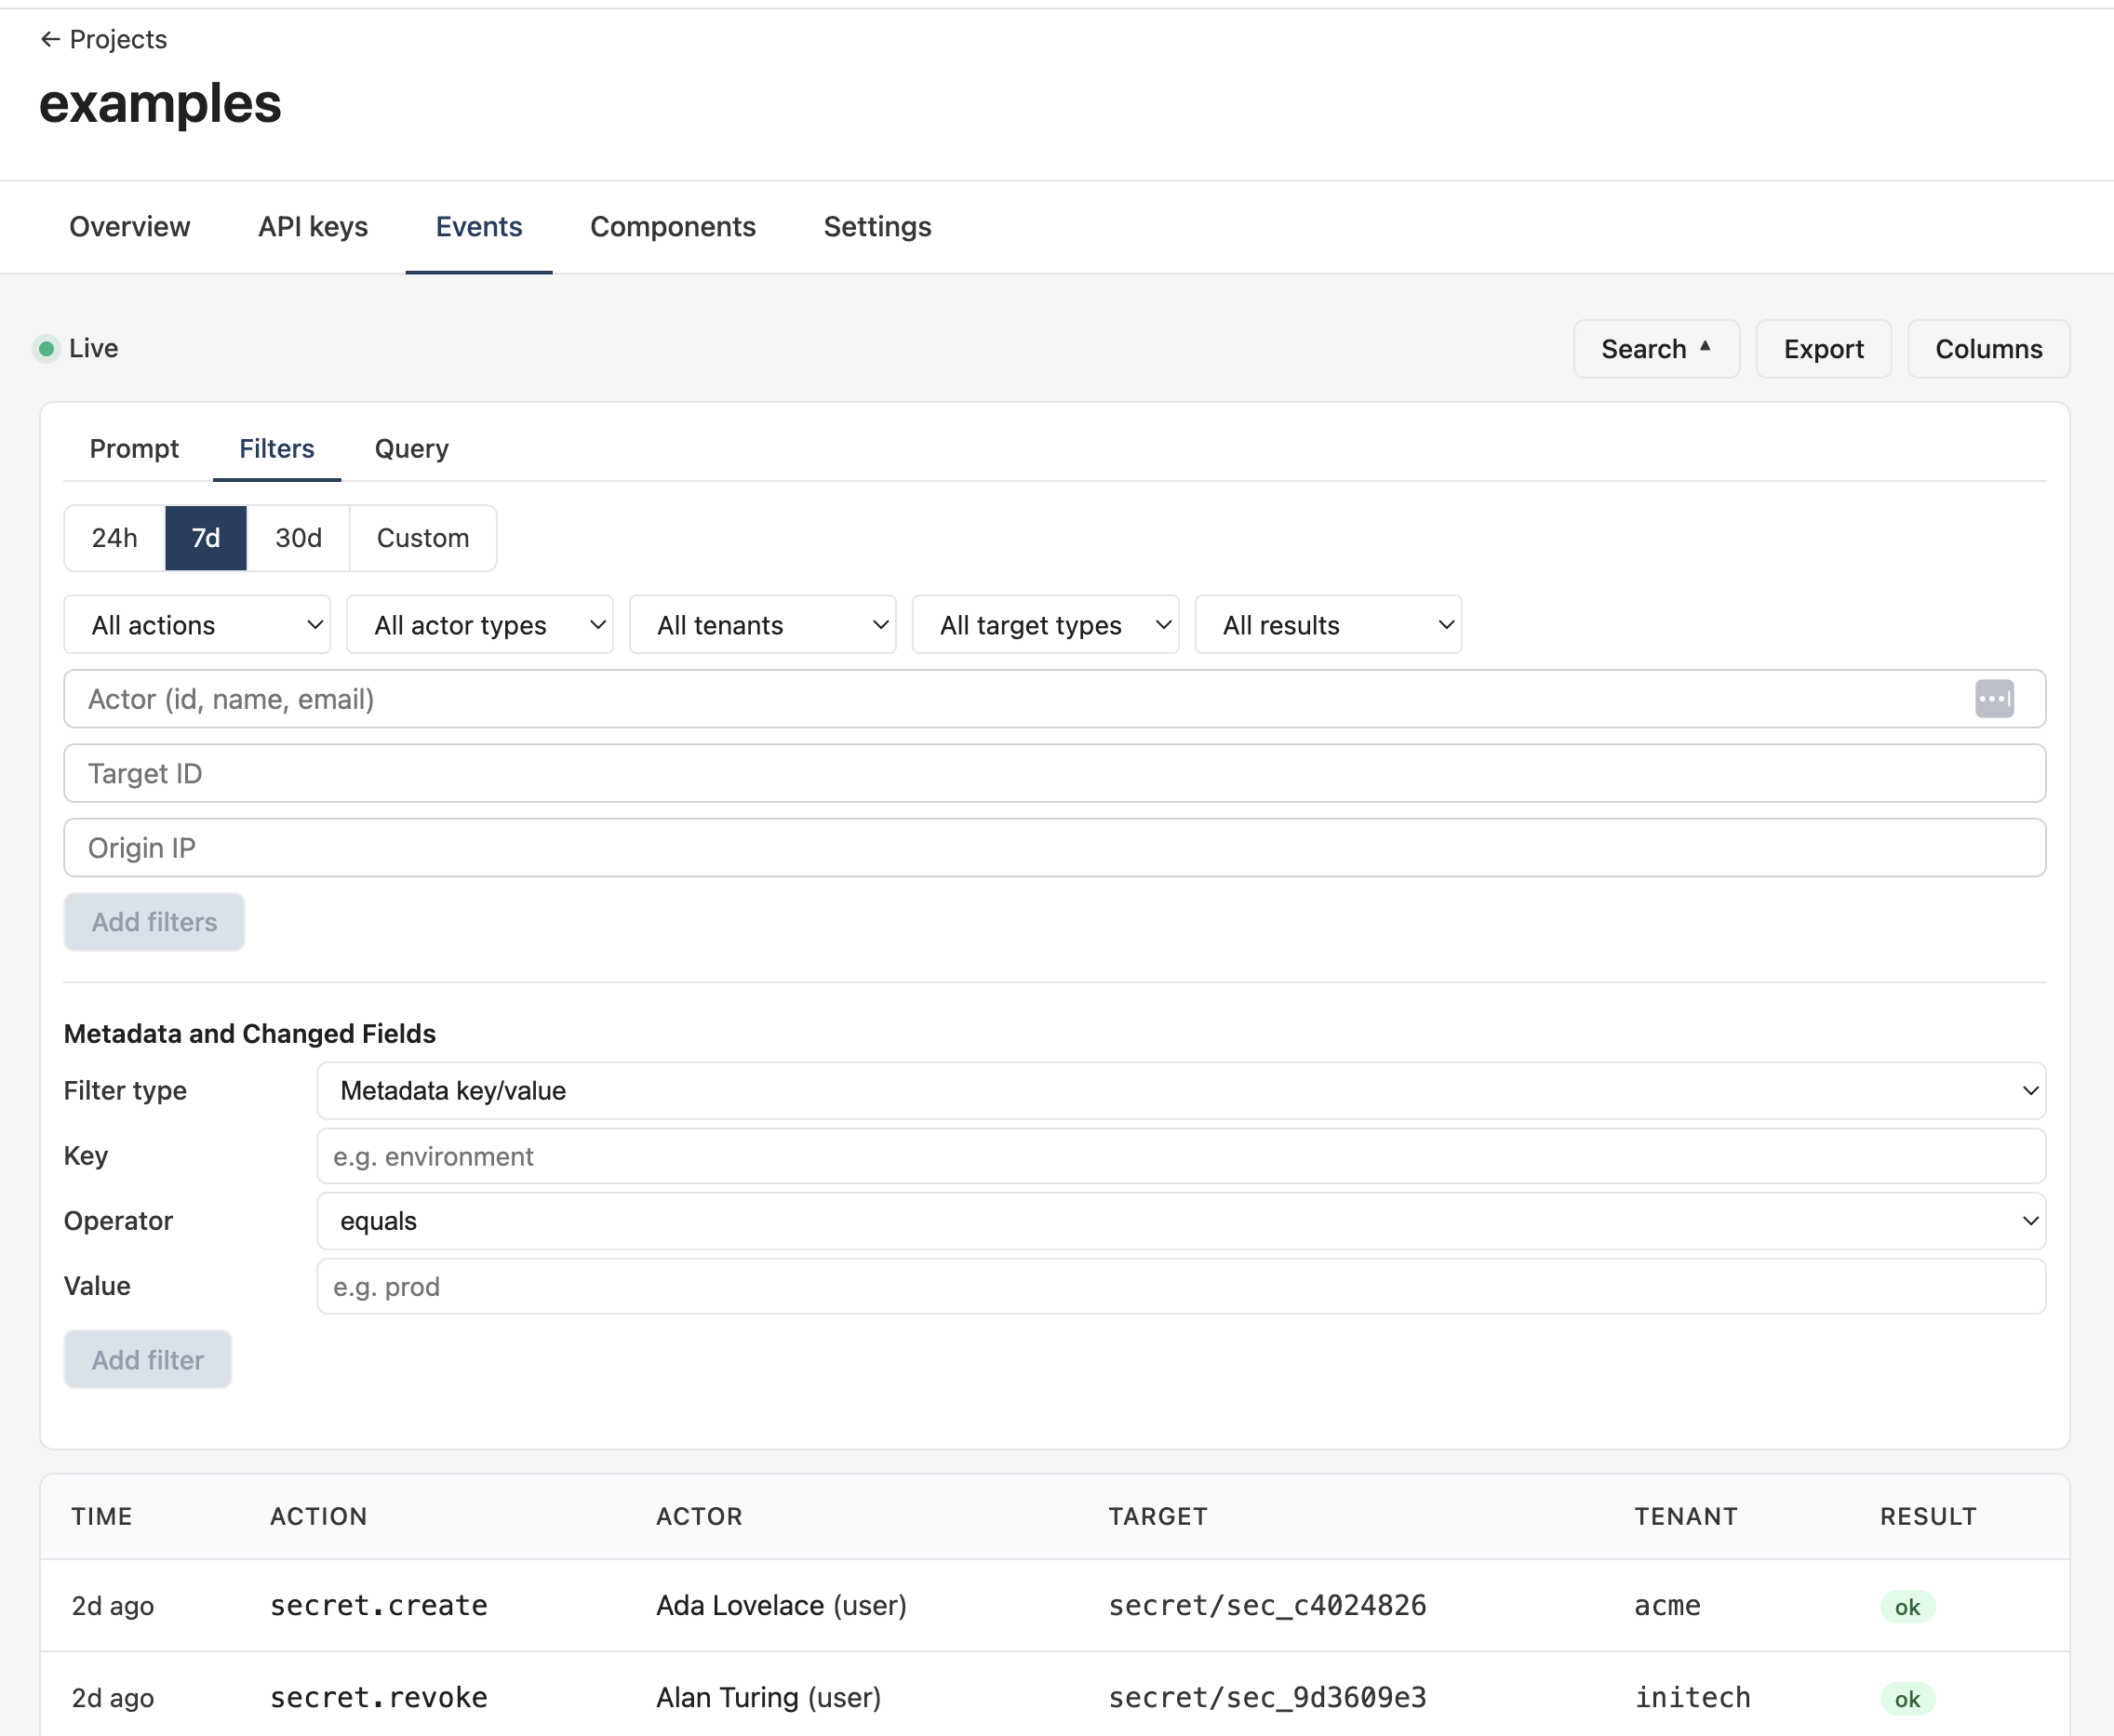
Filters
The Filters tab is structured search — dropdowns for action, actor type, tenant, target type, and result; free-text inputs for actor (id / name / email), target ID, and origin IP; plus an inline builder for metadata.<key> and change.<field> clauses. Pick a time-range preset (24h / 7d / 30d / Custom) and the filters apply on click.
Inspecting
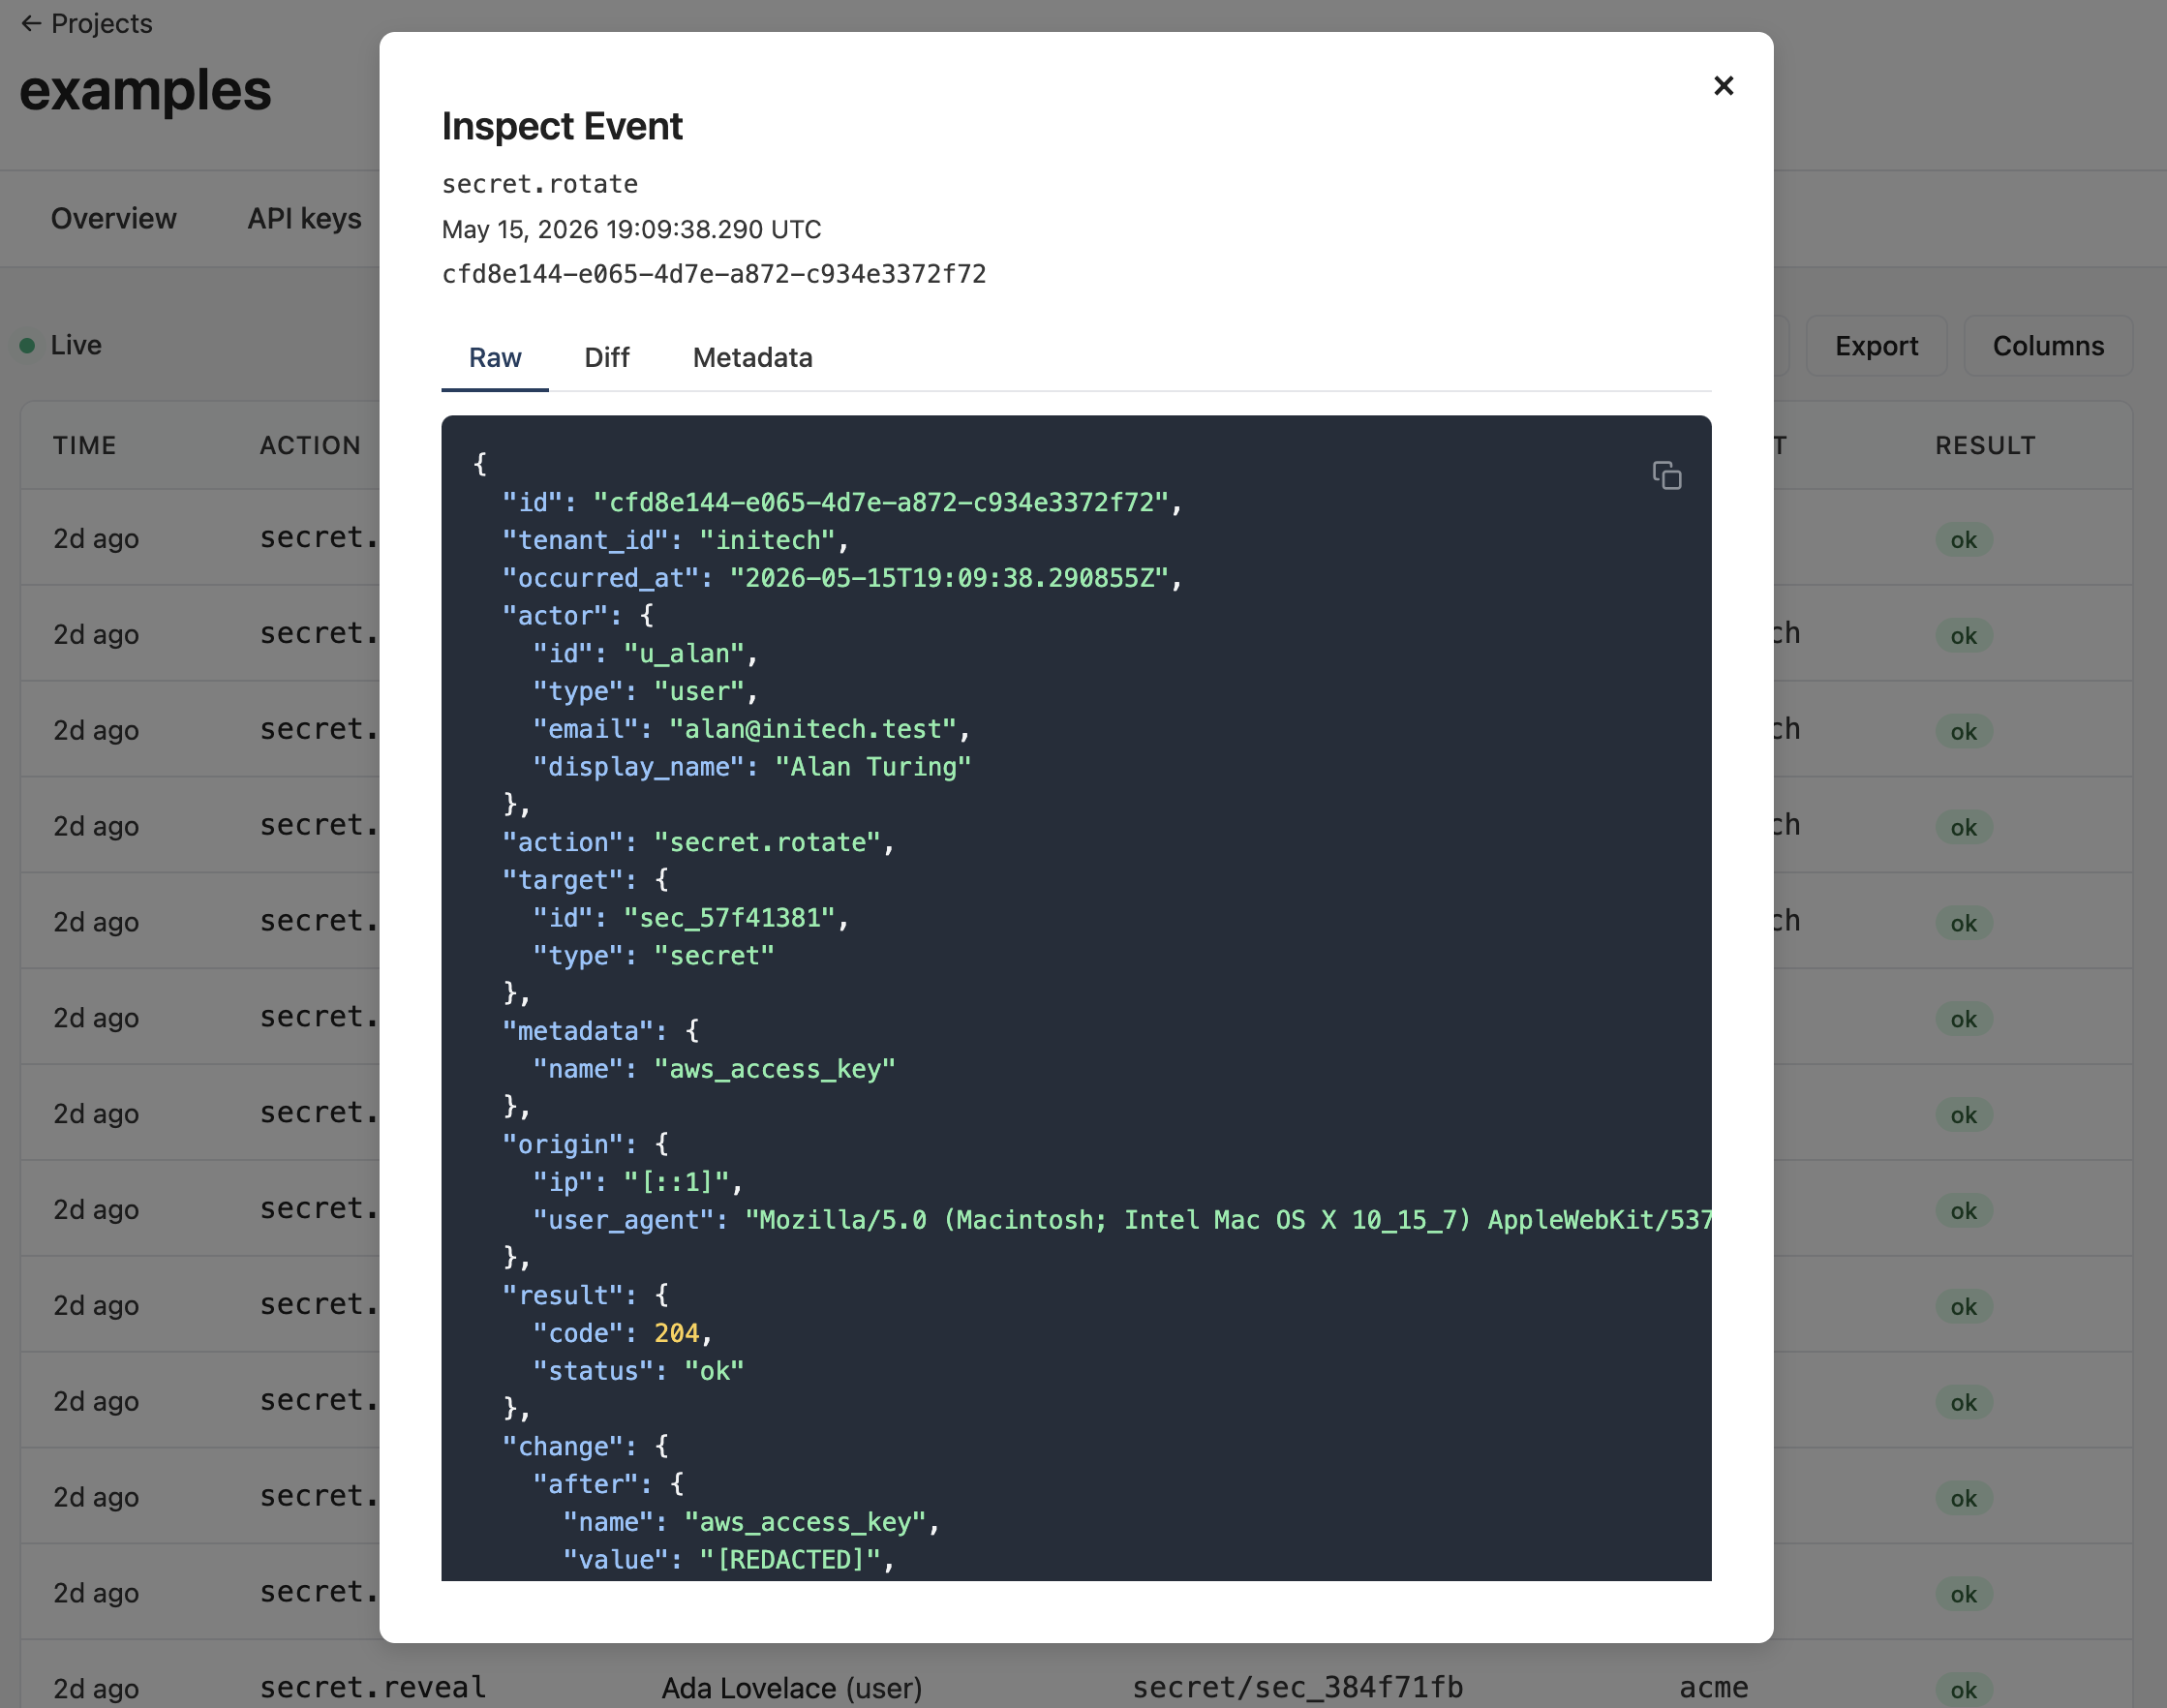
Click any row to open the Inspect Event modal. Three tabs:
Raw
Shows the full JSON payload — every field the API returns for this event, including actor, target, metadata, origin, result, and change. The copy icon top-right grabs the whole document. This is what your SDK or the es CLI would see.
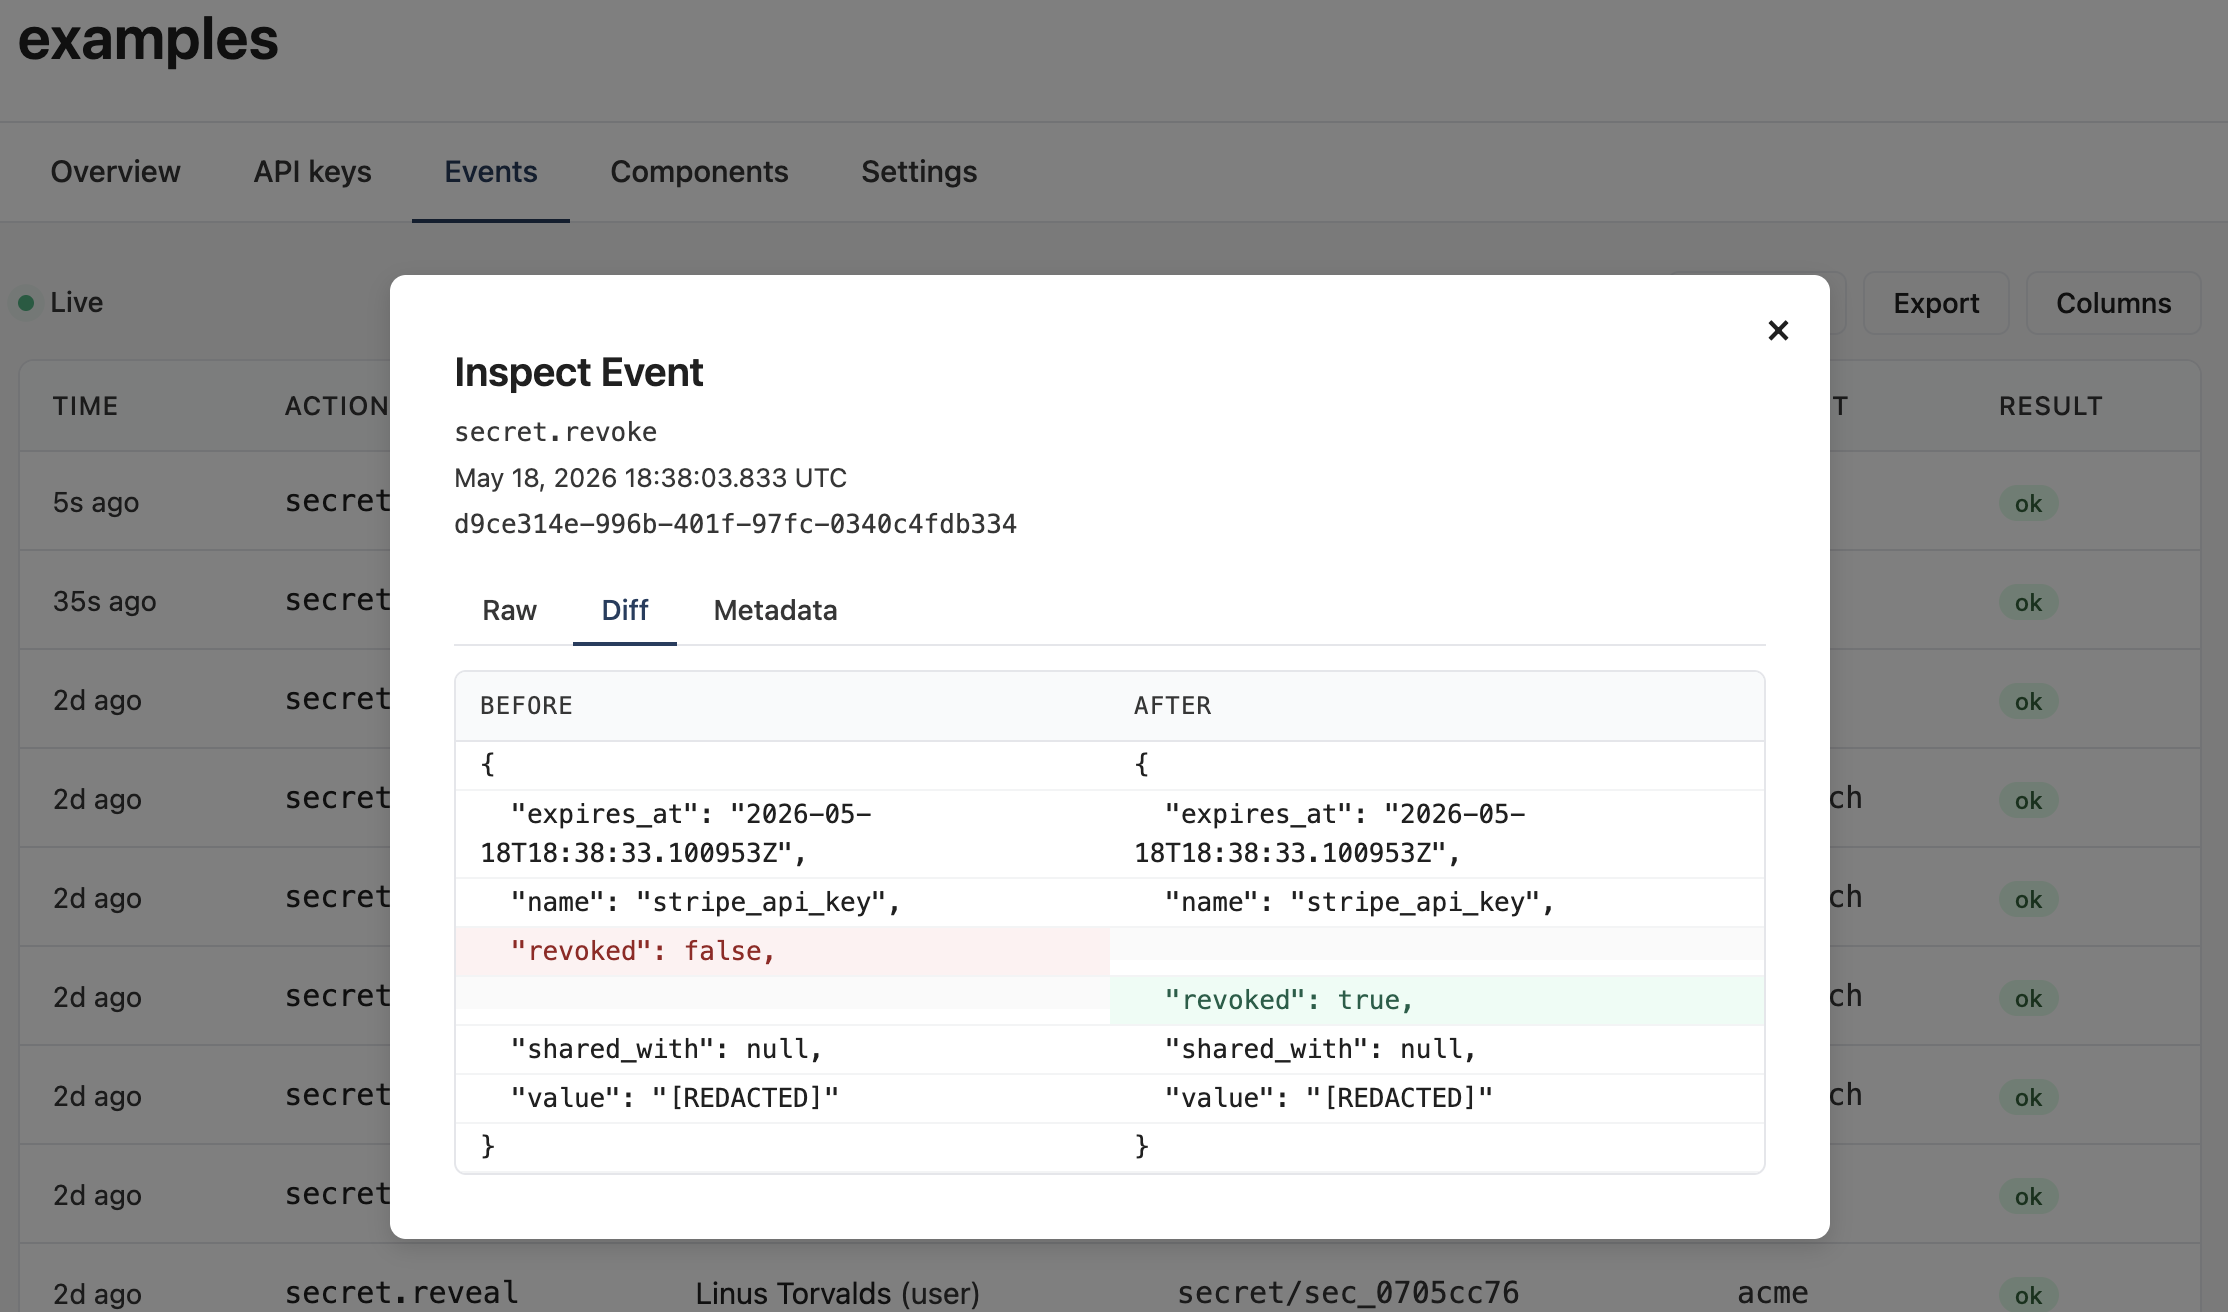
Diff
Appears only for mutation events (anything where the recorder called e.Diff(before, after)). Side-by-side before / after with redacted fields scrubbed. Changed lines are highlighted; unchanged lines provide context so the diff reads top-to-bottom like a code review.
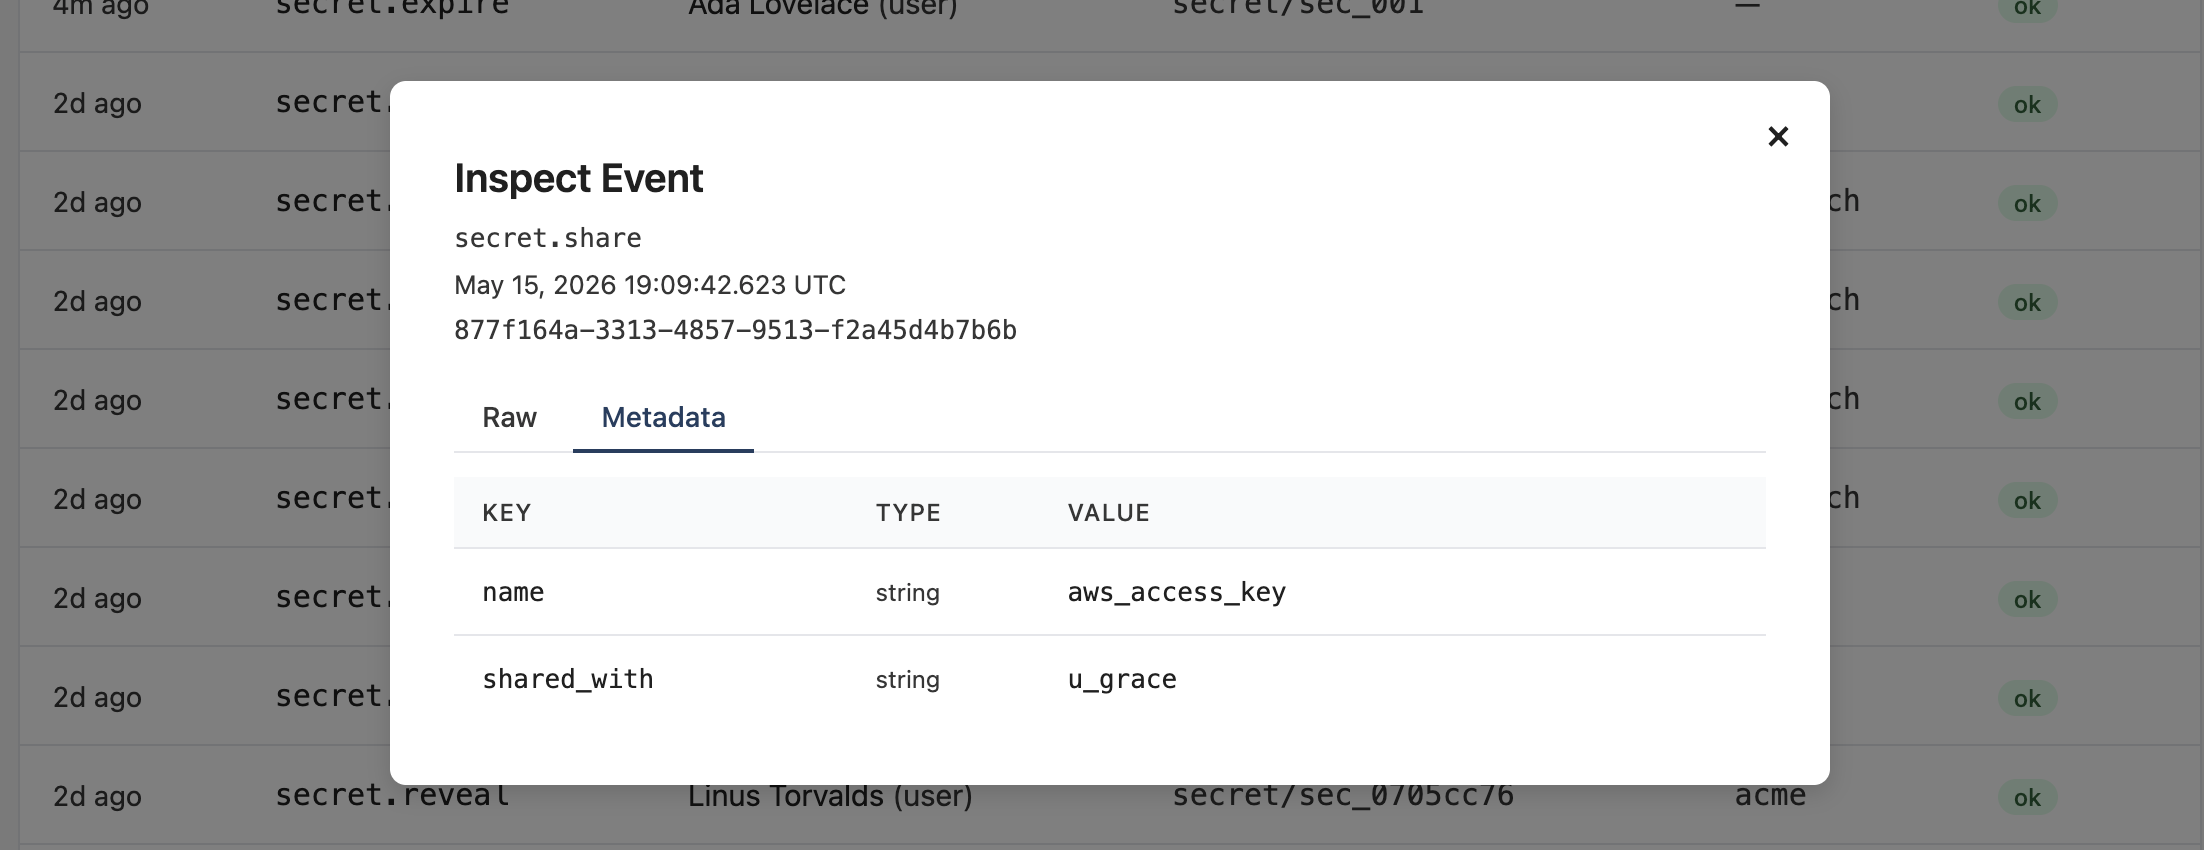
Metadata
Unfolds the event's metadata map as a typed table — key, type, value. Faster to scan than the raw JSON when you only care about the user-supplied context fields.
Showing and hiding columns
The Columns dropdown toggles which fields render in the table. Time / Action / Actor / Target / Tenant / Result are the defaults; Show all reveals every column the project has data for (including origin, metadata, change, idempotency_key).
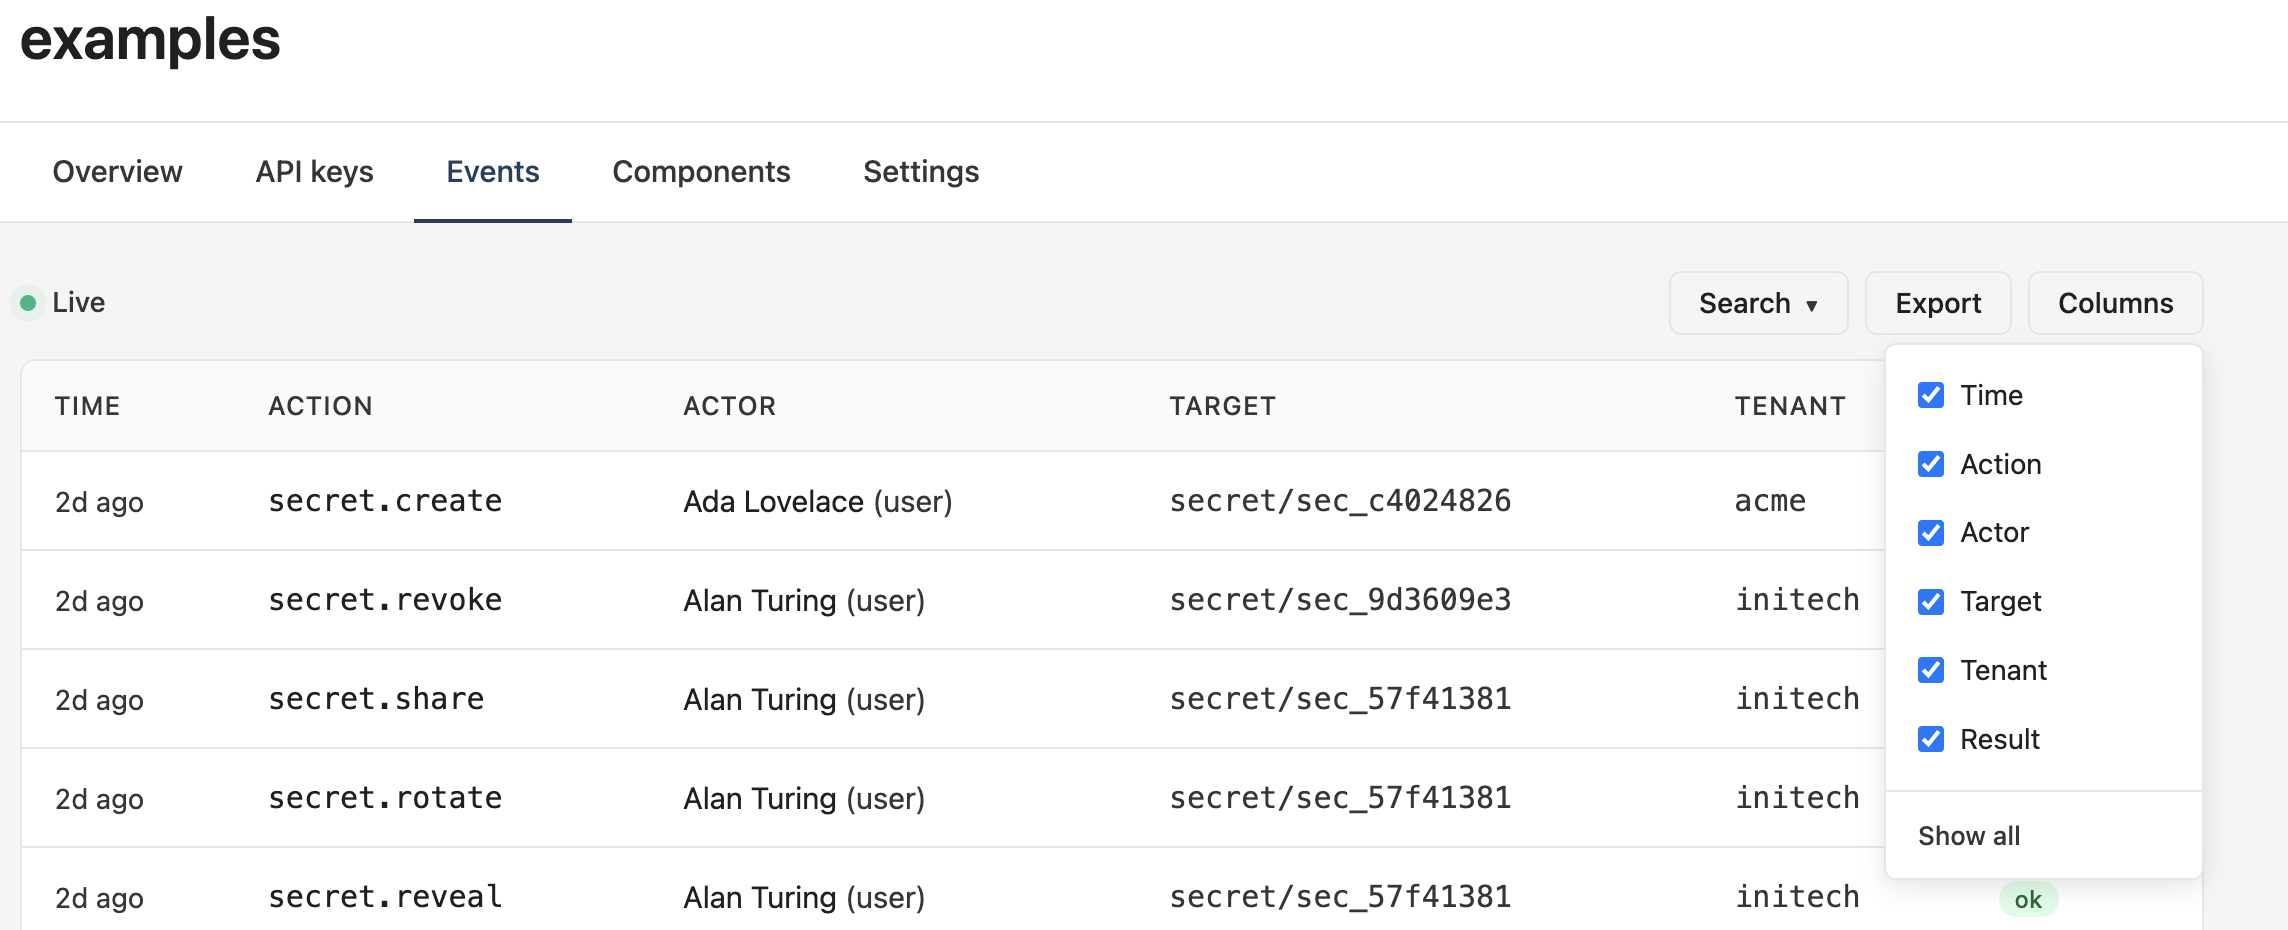
Column visibility is local to your browser — it doesn't affect what teammates see.
Exporting
The Export button hands you a downloadable file with the current filters and time range applied. Two formats:
- CSV — spreadsheet-friendly. Common fields are columns; nested fields (
origin,metadata,change) are JSON in single columns. - JSON — full event objects preserving nested structure. Same shape the API returns.
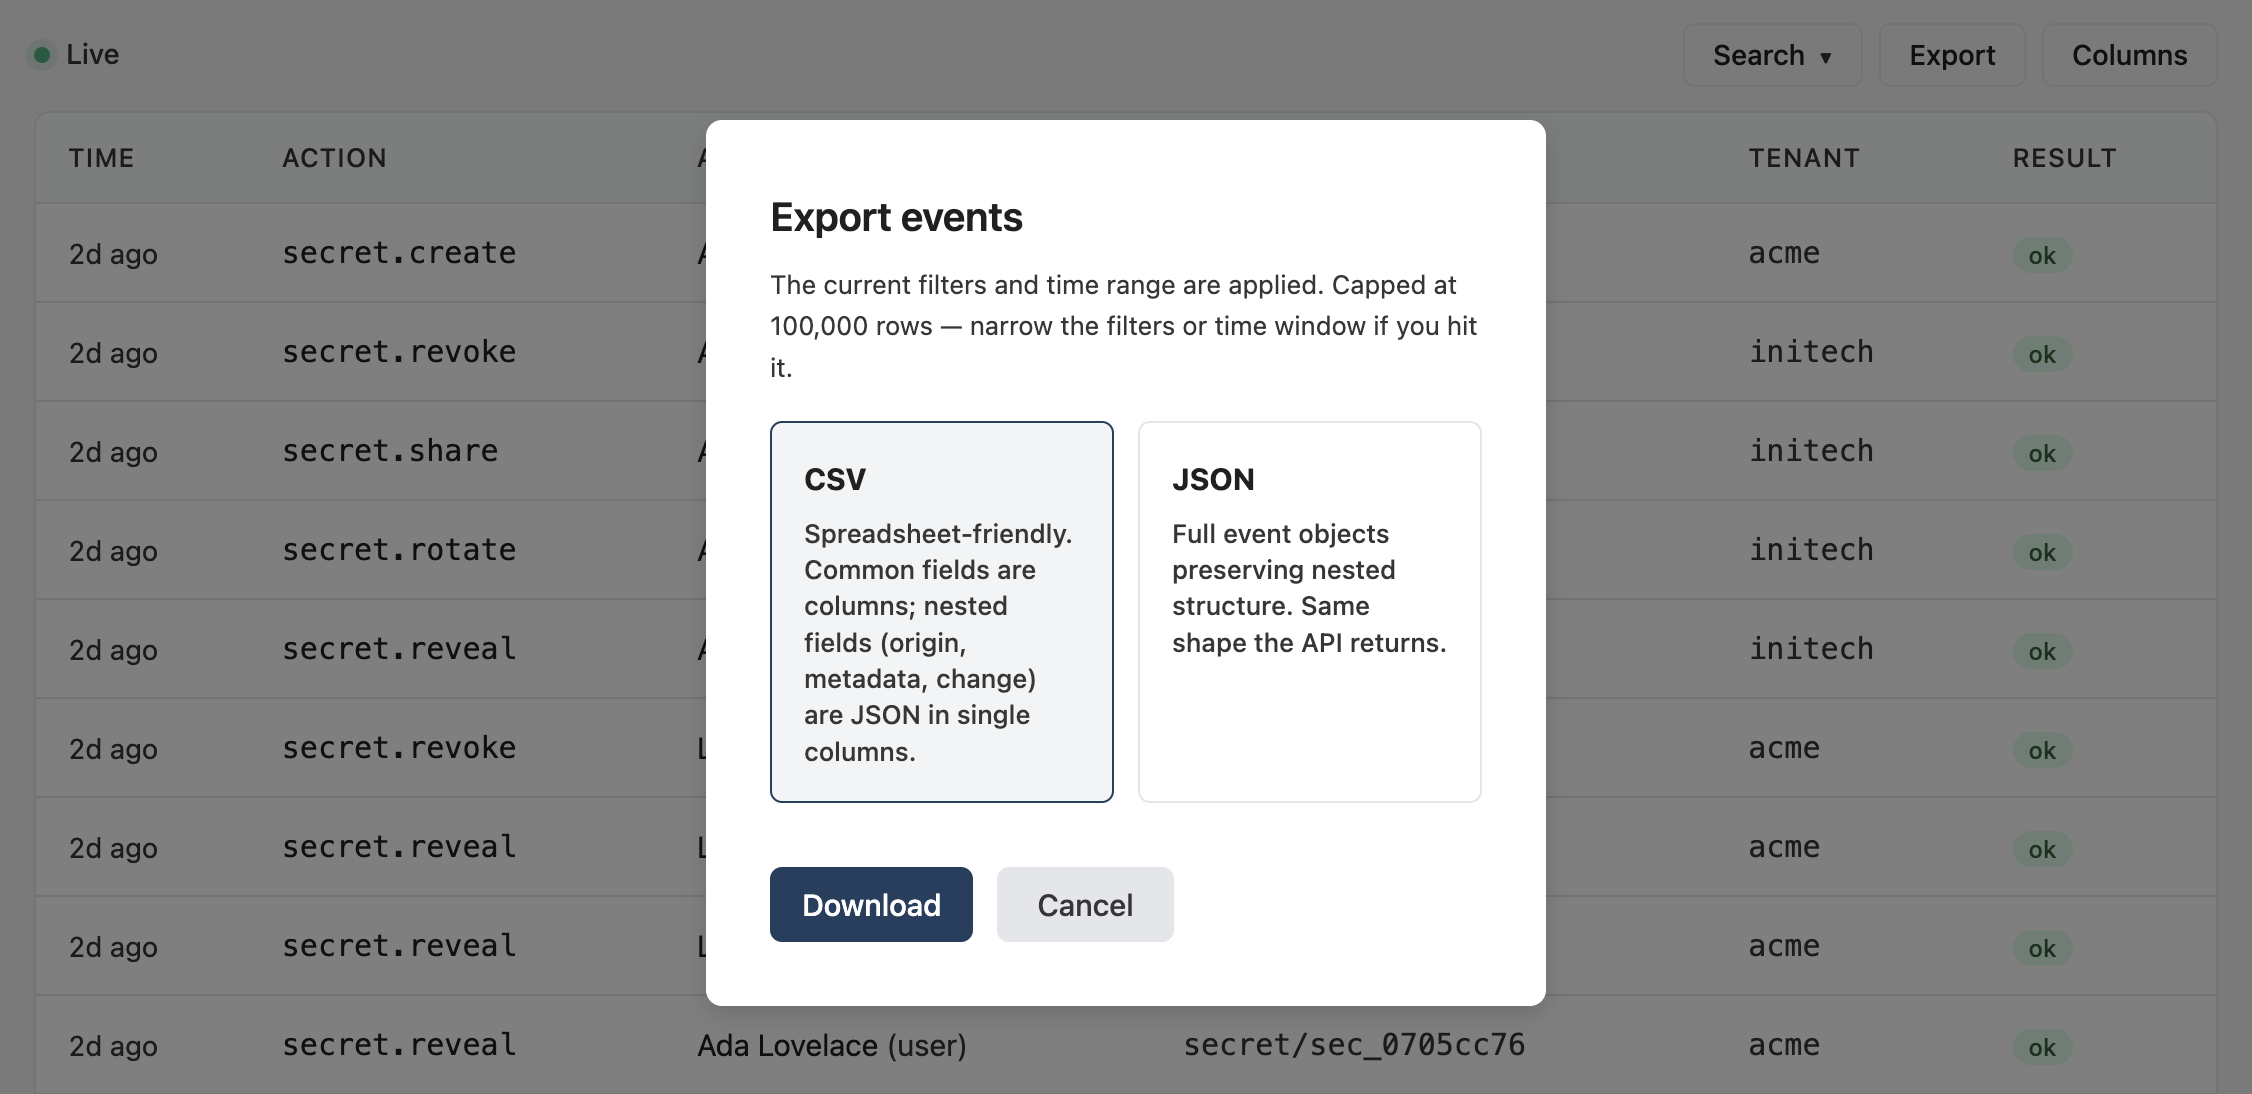
Exports are capped at 100,000 rows — narrow the filters or time window if you hit the limit. For unbounded extraction, use es events list --all or the API directly.
Embedding
The Everscribe dashboard isn't only for you and your team. You can drop the same events UI into your own application so you can provide your users with audit trails as well.
The below screenshot is from the multi-tenant variant of the React + Go full-stack example.
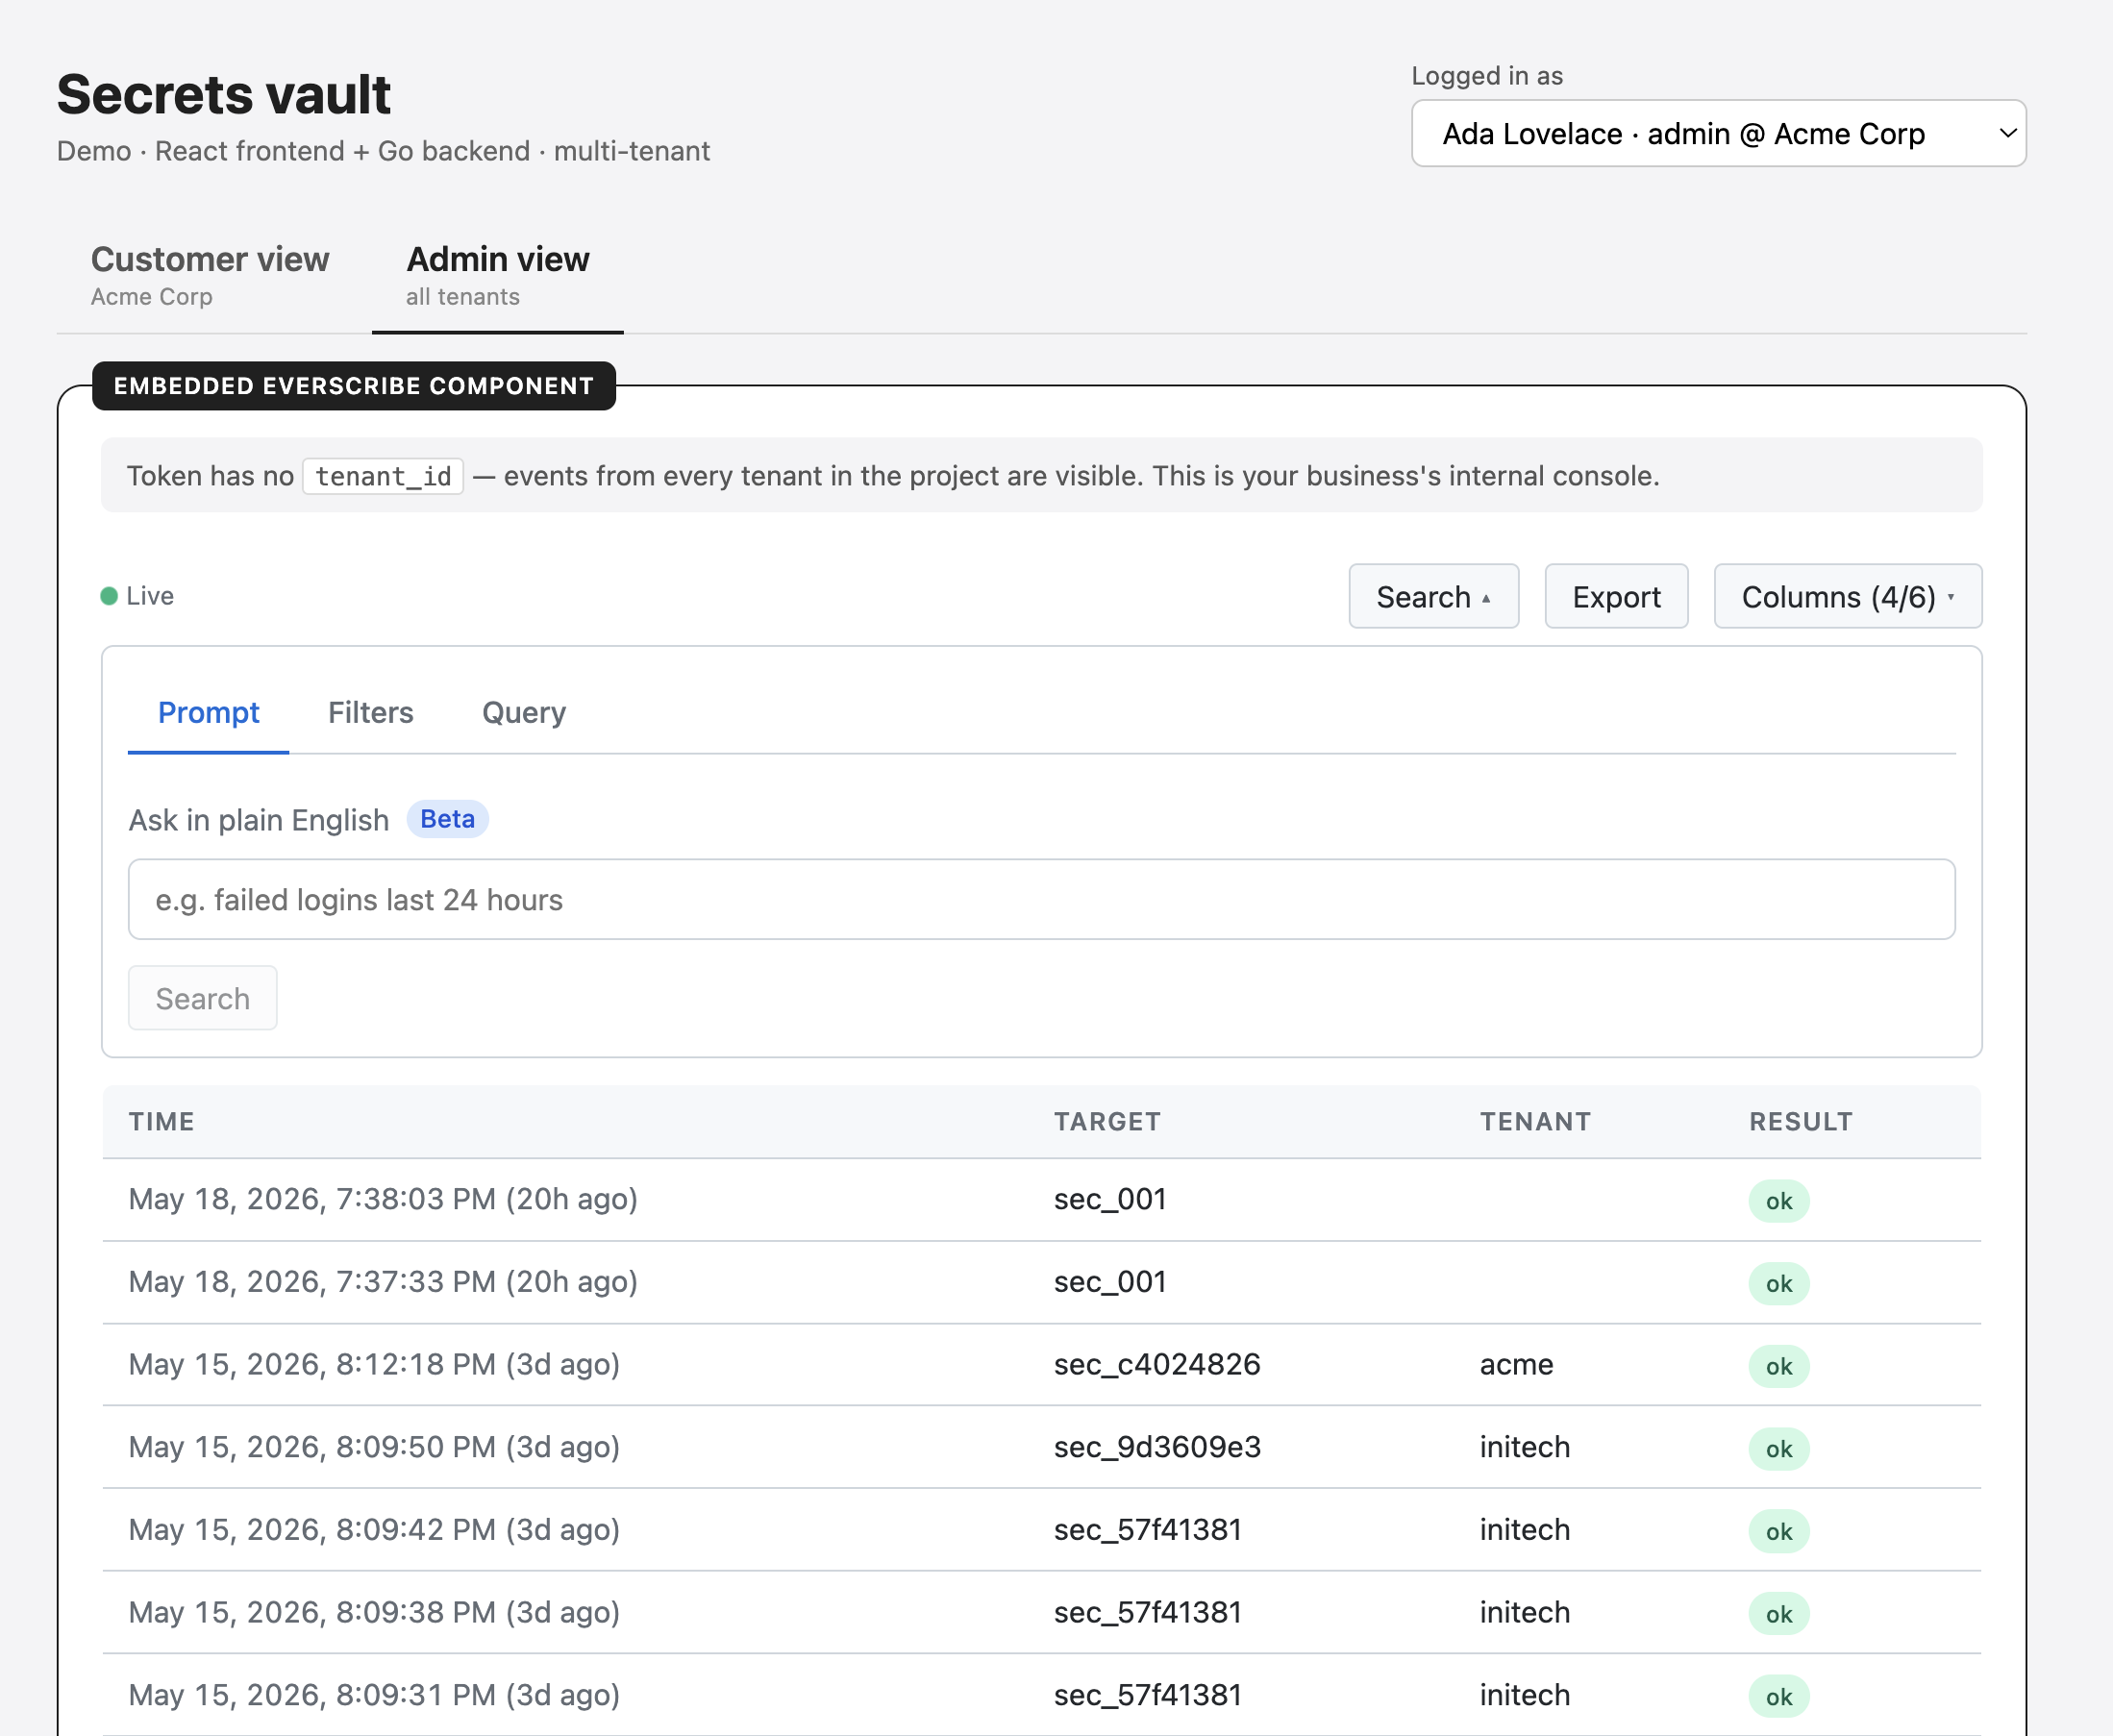
What you get:
- The same UI — AI search, filter, inspect, export — running inside your app, reading the events your application records.
- Brand-matched styling — override a handful of CSS variables to align with your design system, or override class names for surgical changes.
- Tenant-scoped reads — mint a short-lived token scoped to the signed-in customer's tenant (multi-tenant) or unscoped (single-tenant / admin tools). Your project API key never reaches the browser; only the token does, and the server enforces every claim on every read.
See the Web Components → Overview for the end-to-end embed model: how tokens are minted, the refresh chain, claim-driven UI, theming, and rate limits. Per-package install instructions live at React, Svelte, and Vanilla JS. The Full-Stack Examples section has runnable end-to-end demos in every supported stack.